Answers to
Expensive Questions.
opt2mize connects AI to your business, giving you a financial analyst that understands your numbers, monitors performance, and helps you answer your most expensive questions.
Accounting. Sales. Payroll. Inventory. Customers. Spreadsheets. One connected view of your business.
Not yet — revenue is ahead, but margin performance puts the profit goal at risk.
See an expensive question get answered.
Watch opt2mize bring business data together, investigate a real question, and show the numbers and tradeoffs behind the decision.
Every business has expensive questions.
The evidence is usually buried across accounting systems, spreadsheets, payroll reports and sales data. opt2mize brings it together and helps you answer the questions that affect cash, profit, growth and risk.
Cash
- Can I afford this purchase?
- How much cash is truly available?
- Which invoices should I collect first?
- What payments should I be worried about?
Profit
- Why did profit fall?
- What changed in our margins?
- Where are we losing money?
- Which expenses increased?
Growth
- Can I afford another employee?
- Should I raise prices?
- Can I open another location?
- Will this investment pay for itself?
Customers
- Who owes us money?
- Who are our most profitable customers?
- Which customers stopped buying?
- Where should we focus?
Operations
- What needs my attention today?
- Where are we falling behind?
- Which location is underperforming?
- What changed unexpectedly?
People
- Is payroll too high?
- What is driving overtime?
- Are we overstaffed?
- Can we afford another hire?
Know what matters before your first meeting.
Ask opt2mize what changed, and it surfaces what's worth your attention — instead of making you dig for it.
- Revenue was up 6% yesterday.
- Cash declined 9% this week.
- Three invoices totaling $18,420 became overdue.
- Labor reached 32.1% of sales versus a 28.4% recent average.
- The Downtown location drove most of this week's margin decline.
See the numbers behind every important decision.
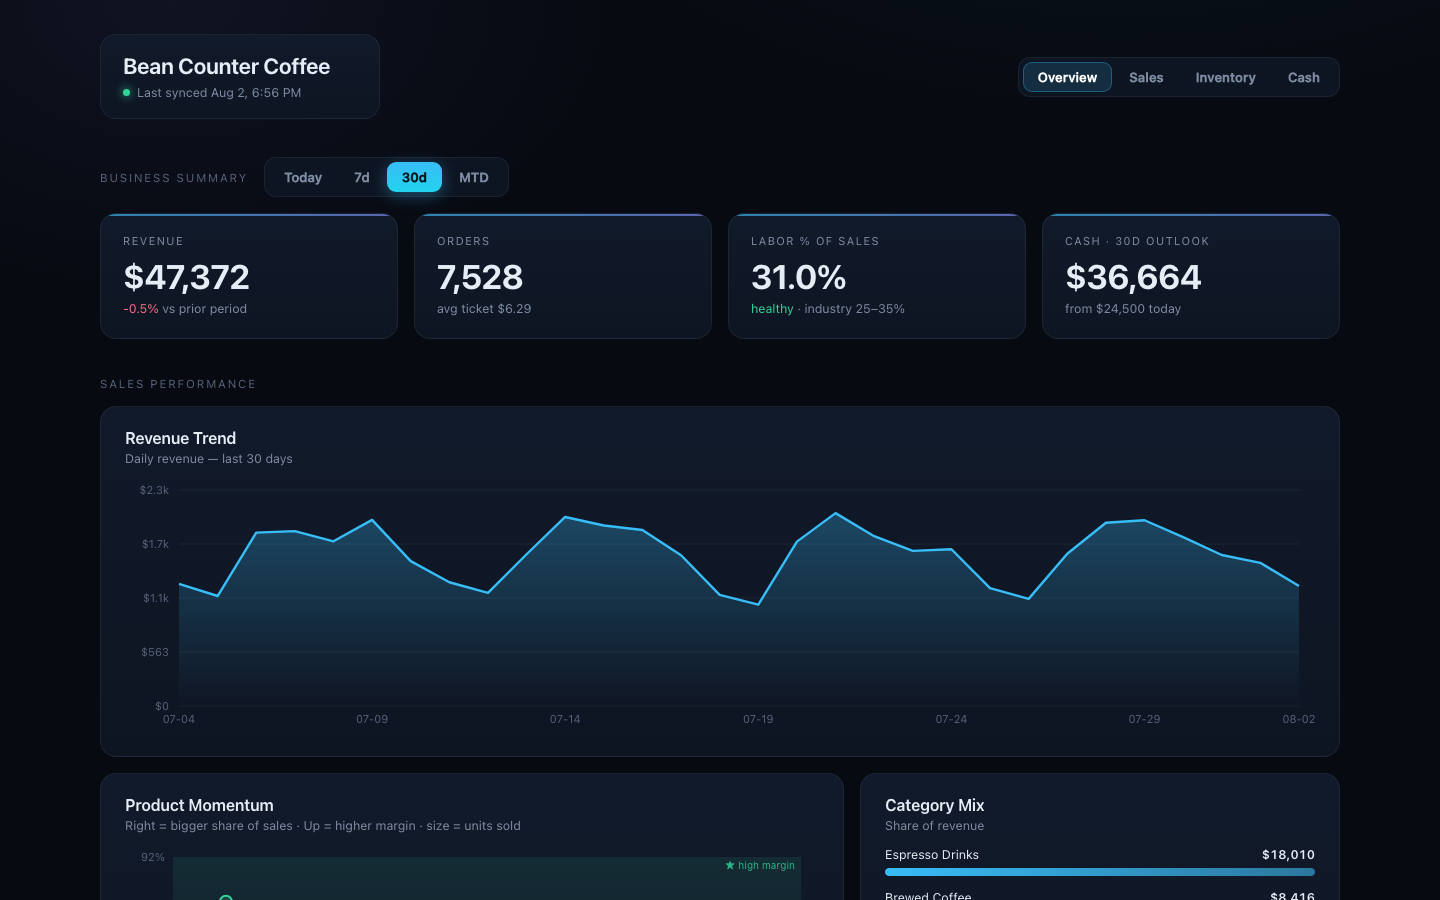
A clear view of the business — revenue, cash, margin, labor, receivables. When something changes, you can investigate it instead of digging through reports.
Your systems stay. The answers get easier to find.
Nothing gets ripped out or replaced. Your data becomes something you can finally ask questions of.
Connect
Connect the software your business already uses.
Organize
opt2mize brings the information together into one usable view of the business.
Ask
Ask questions in plain English — through the assistant you already use, or your dashboard.
Decide
Understand what changed, why it matters, and what deserves your attention.
Your business already has the data.
opt2mize connects the systems where that information already lives. We start with the sources that matter most and handle setup during onboarding.
What's your most expensive question?
Show us how your business operates, and we'll show you what opt2mize could help you answer.